Thought Piece
In lieu of a few anecdotes and under-researching, here is an excellent, nonpartisan report on methane emissions in total and by region. Seth Whitehouse and Energy in Depth have used the data directly from the EPA over the last 8 years. Along with the recent Health and Wellness report done by Sue Mickley, this report is clear-eyed and reliable.
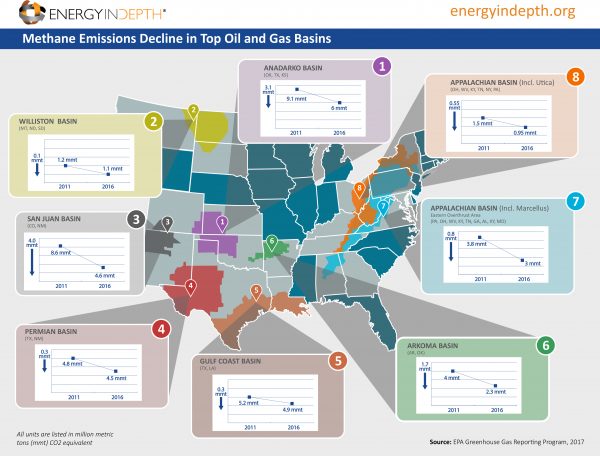
REPORT: METHANE EMISSIONS CONTINUE TO DECLINE IN TOP OIL AND GAS BASINS
DECEMBER 20, 2017 | SETH WHITEHEAD
A new Energy in Depth report shows that methane emissions from oil and natural gas development continue to decline in many of the top basins across the United States even as oil and gas production continues to increase.
Based on the latest data from the U.S. Environmental Protection Agency’s (EPA) Greenhouse Gas Reporting Program, EID’s report shows methane emissions from the most productive shale basins in the country have fallen considerably in the past six years. These reductions have been achieved even as oil and natural gas production has increased 54 percent and 16 percent, respectively, during that time thanks to advances in horizontal drilling and hydraulic fracturing technology.
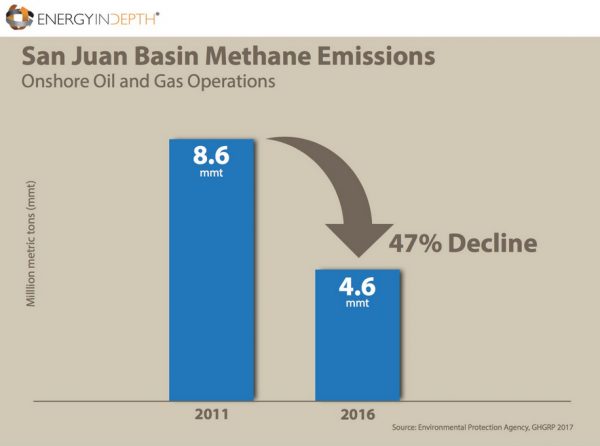
For example, in the San Juan Basin — long a focal point of the “Keep It In The Ground” movement’s push for methane regulations, due to the presence of a methane “hot spot” above the Four Corners region of the basin — methane emissions have fallen by 47 percent since 2011, as the following EID graphic illustrates.
In the Appalachian Basin — which includes the surging Marcellus and Utica shales — methane emissions have fallen 26 percent since 2011 at the same time natural gas production in the region has more than quadrupled, as the following Energy Information Administration (EIA) graphic illustrates.
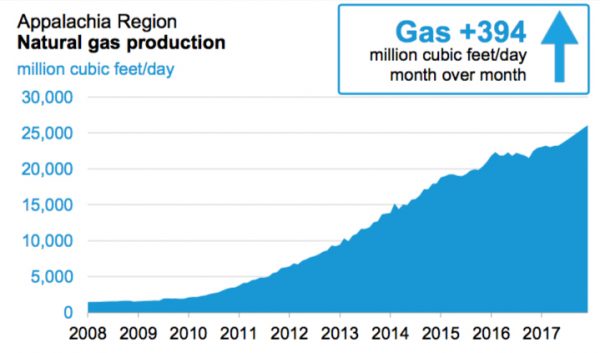
The EIA recently noted the Appalachian Basin has increased natural gas production by 14 billion cubic feet per day (Bcf/d) since 2012, growing from 7.8 Bcf/d in 2012 to an incredible 23.8 Bcf/d in 2017.
Speaking of surging production, the Permian Basin, has experienced such a historical production increase in recent years that the term “Permania” has been coined to describe the boom currently underway in west Texas and New Mexico, which is illustrated in the following EIA graphics.
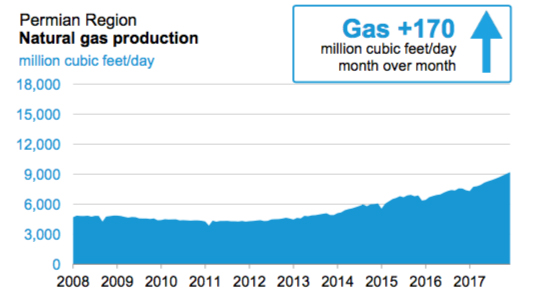
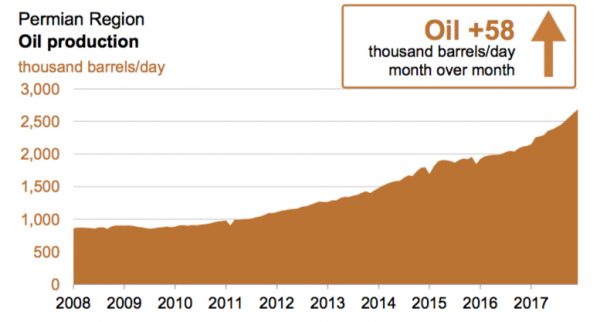
Despite the fact that production in the Permian doubled from 2011 to 2016, methane emissions have decreased 6.3 percent, according to GHGRP data. Coupled with a 5.8 percent reduction in methane emissions in the Gulf Coast Basin since 2011, EPA data confirms that the country’s top oil- and gas-producing state is also a leader in methane emission reductions.
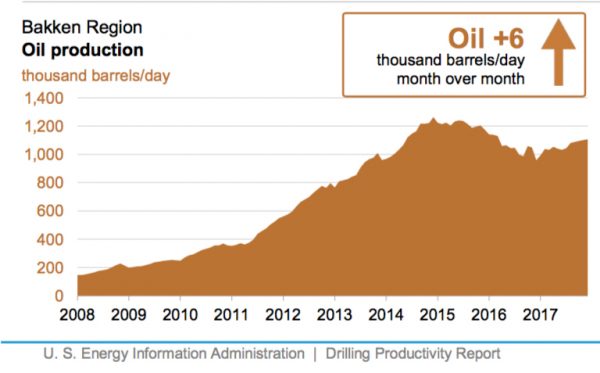
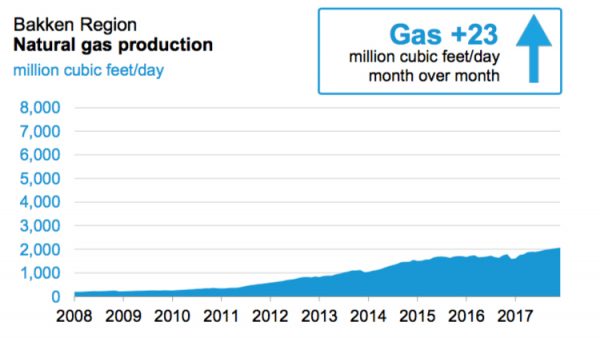
EPA data also show that methane emissions in the Williston Basin — home of the Bakken Shale in North Dakota and Montana — have fallen 8.3 percent from 2011 to 2016. These declines came at the same time that oil and natural gas production in the region has quadrupled, as the following EIA graphics show.
Similarly, the Anadarko has emerged as one of the fastest growing oil and natural gas basins in recent years. But despite being one of the fastest growing basins in the country, methane emissions in the Anadarko Basin have decreased 34 percent since 2011 at the same time production has reached new heights.

Overall, EPA GHGRP data show methane emissions from major onshore oil and natural gas production facilities declined by nearly 14 million metric tons between 2011 and 2016.
As “Keep It In the Ground” groups continue to push the EPA and BLM methane rules — claiming that voluntary efforts such as the initiative recently announced by the American Petroleum Institute don’t work — this data show that the exact opposite is true. As the EPA observed in 2014:
“The decrease in production emissions is due to increased voluntary reductions, from activities such as replacing high bleed pneumatic devices, regulatory reductions, and the increased use of plunger lifts for liquids unloading.”
Check out EID’s infographic — Methane Emissions Decline in Top Oil and Gas Basins — to learn more.


